Plotting datafiles
a_plot_olfa_and_pid.m
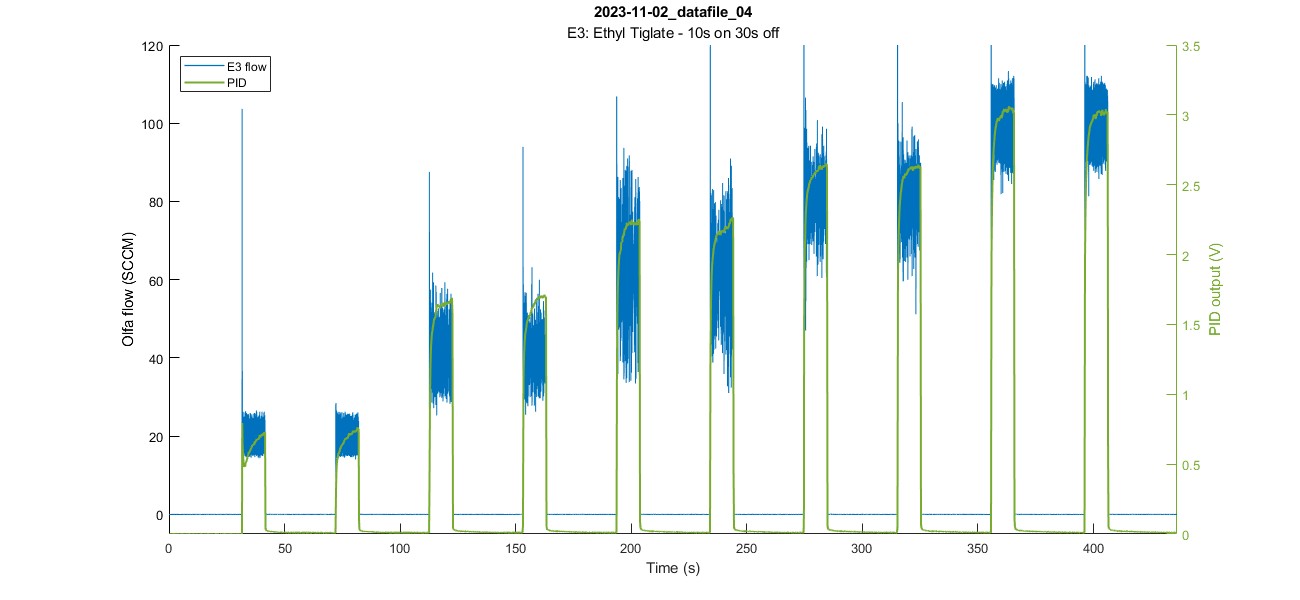
Plots olfactometer & PID data over time
Syntax
a_plot_olfa_and_pid(a_thisfile_name) creates a plot of the data in the given file over time.
a_plot_olfa_and_pid(a_thisfile_name,plot_opts) specifies the plot options.
Example:
a_plot_olfa_and_pid('2023-11-02_datafile_04',pid_lims=[0 3.5]);
Plots datafile "2023-11-02_datafile_04" with PID (Y-axis) limits set from 0 to 3.5.
 More details here
a_plot_spt_char.m
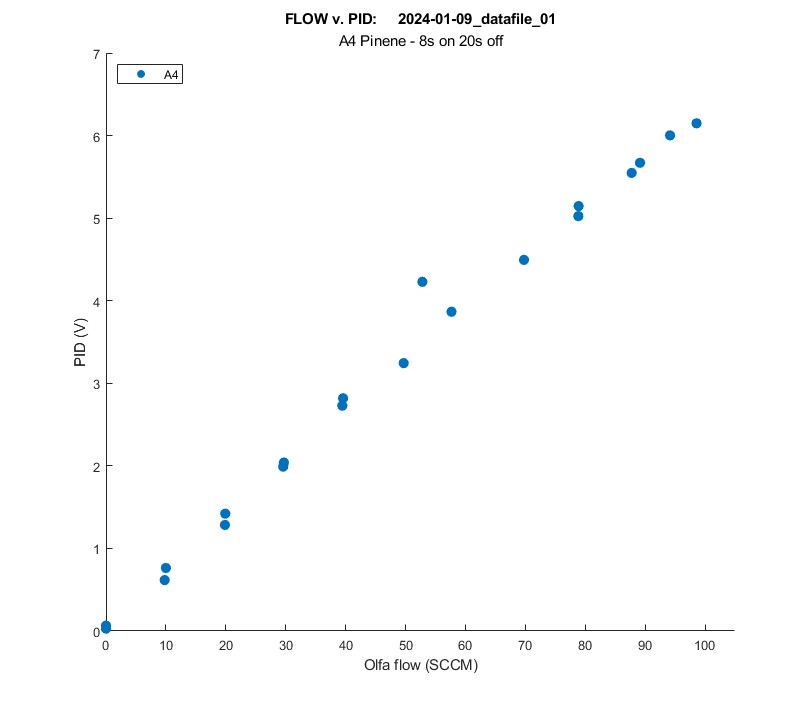
Plots setpoint characterization of trial (Flow v. PID plot)
Syntax
a_plot_spt_char(filename) plots the setpoint characterization figure (flow vs. PID) of the given file.
a_plot_spt_char(filename,plot_opts) plots the setpoint characterization figure (flow vs. PID) of the given file using the additional plot options specified.
Example:
a_plot_spt_char('2024-01-09_datafile_01');
 More details here
a_plot_on_top
Plots a bunch of files on top of each other
Syntax
a_plot_on_top(file_names,a_title,a_subtitle) plots the files in the array file_names
More details here
analysis_plot_standard_olfa.m
Plots file from standard olfactometer
Description:
--> Loads *.csv file (from OlfaControl_GUI\results_files\standard olfa)
--> Parses file & saves to OlfaControl_GUI\analysis\data (.mat files)
--> Plots the setpoint characterization figure
More details here